Background
The patient is a 60-year-old female with a history of alcohol use disorder, chronic pancreatitis, seizure disorder, and hypertension who presents to the emergency department with diffuse, severe, and constant abdominal pain. She described the pain as burning, and it was associated with non-bloody non-bilious vomiting, lightheadedness, and palpitations. EKGs from one year prior, initial presentation, and after treatment are shown below.
Prior EKG:

EKG on Presentation:
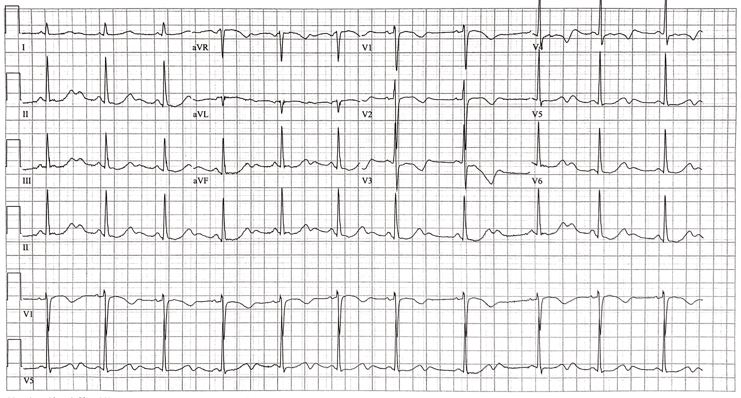
EKG After Treatment:

Which of the following abnormalities listed below does this patient have?
A. U waves
B. Bifid T waves
C. 3rd degree AV block
D. Osborn wave
E. Epsilon wave
Answer: U waves
In this interesting case, we have a middle-aged lady presenting with abdominal pain in the setting of chronic pancreatitis and alcohol use disorder.
The EKG at this time was read as normal sinus rhythm with U waves. In addition to U waves, this patient also has a short PR interval, prolonged QTc, and 1mm ST segment depression (best seen in lead V5, present in other leads as well). We will focus our discussion on U waves, which are often seen on EKGs and can be confusing.
Bifid T waves are described below.
Third degree AV block, also known as complete heart block, occurs when there is absence of conduction between the atria and the ventricles. Thus, none of the supraventricular impulses reach the ventricles. This results in different atrial and ventricular rates, while rhythm is often maintained by an escape rhythm. Patients with this condition are at high risk for sudden cardiac death.
Epsilon waves are an “electric signal of depolarization observed between the end of the QRS complex and the beginning of the T wave.” They are seen in arrhythmogenic right ventricular dysplasia.
Osborn waves are a dome shaped deflection seen at the J point. They are most commonly seen in hypothermia and hypercalcemia.
U Waves
U waves were discovered by Einthoven in 1903, seven years after he developed the EKG. They are the final wave of the cardiac cycle seen on EKG. They are a normal finding, and can be better appreciated under certain conditions. However, prominent and inverted U wave morphologies are concerning for underlying abnormalities.
Etiology of U Waves
The origin of U waves is unknown. There are 4 theories under consideration, and they all have to do with delayed repolarization of some cardiac structure. None of these theories, however, are foolproof. The 4 theories are:
1. Repolarization of the Purkinje Fibers
2. Delayed repolarization of the papillary muscles
3. After-potentials caused by mechanical forces (stretch) in the ventricular wall
4. Prolonged repolarization of myocardial M cells
Morphology and characteristics of the normal U wave
U waves have been found to occur in cardiac diastole. They are concomitant to either the S2 or S3 heart sounds, and occur during the isovolemic filling phase of the cardiac cycle. They usually have the same polarity as the preceding T wave, though the morphology of the two waves is different. First, U waves are of lower amplitude, usually between 3-24% of its preceding T wave. Second, T waves have a slow ascent and rapid descent, while U waves have a rapid ascent and a slower descent. U waves are best seen in leads V2, V3, and V4 because of their position of +60o on the cardiac axis. U waves last for 170 +/- 30msec. The distance from the end of the T wave to the end of the U wave is usually 160-230msec in patients with a heart rate between 50-100 beats per minute.
As mentioned, T and U waves usually have the same polarity. This is known as concordance. Patients with negative T waves and positive U waves are called Type I discordance. Patients with positive T waves and negative U waves are named Type II discordance. Finally, patients can have both T and U waves be negative. It has been found that coronary artery disease is more common in a Type I discordance than a Type II.
Prominent U waves are seen when the amplitude is 1.5mm or greater. However, the normal variation in leads II and V2-V4 can see amplitudes of up to 2mm. There are many causes of prominent U waves. The most common ones are bradycardia, hypokalemia, hypomagnesemia, class 1A, and class III antiarrhythmics. Hypokalemia causes prominent U waves by decreasing the amplitude of the T waves, making the U waves appear larger. Additionally, phenothiazine antipsychotic drugs have properties similar to class 1A antiarrhythmics, and can cause prominent U waves.
One caveat to U waves is the bifid or bimodal T wave. If the apex of the second ‘hump’ is within 150msec of the apex of the first hump, then this is referred to as a bimodal T wave, with the first ‘hump’ called T1, and the second T2. For it to be considered a U wave, the time from T1 to U is >150msec. We can say our patient had U waves because they were seen separate from the T wave, and because they resolved with treatment.
Inverted U waves
Inverted U waves are specific for the presence of heart disease, specifically cardiac ischemia. The inversion can be explained by abnormal relaxation and thus repolarization. Exercise-induced inversion of the U-wave is highly predictive of significant coronary artery disease, specifically of the proximal left anterior descending artery. U waves can disappear after successful revascularization.
Our Case
Looking closely at our EKG, the patient had prominent U waves. The patient’s electrolytes at the time were:
Potassium: 3.4 mEq/L
Magnesium: 1.6 mEq/L
Phosphorus: 2.4 mEq/L

Electrolytes were repleted, and the EKG changes resolved. Repeated electrolytes were:
Potassium: 4.0 mEq/L
Magnesium: 2.1 mEq/L
Phosphorus: 2.4 mEq/L
The EKG changes were likely caused by electrolyte abnormalities because the U waves disappeared after repletion of electrolytes. It should be noted that the patient was only slightly hypokalemic, and that a potassium of 3.4mEq/L does not normally cause prominent U waves. The patient was also started on metoprolol for management of hypertension, and she was not taking any antiepileptic drugs. Ultimately, the patient had an echocardiogram, which showed normal left ventricular size and wall motion, with mild left ventricular hypertrophy.
References
-
Li G-L, Saguner AM, Fontaine GH, Frank R. Epsilon waves: Milestones in the discovery and progress. Ann Noninvasive Electrocardiol. 2018;23:e12571. doi:10.1111/anec.12571
-
Pérez-Riera AR, Barbosa-Barros R, Daminello-Raimundo R, de Abreu LC, García-Niebla J, de Deus Morais MJ, et al. Epsilon wave: A review of historical aspects. Indian Pacing Electrophysiol J. 2019;19:63-67. doi:10.1016/j.ipej.2019.02.003
-
Jain AG, Zafar H, Jain S, D’Souza J. Osborn Waves: Differential Diagnosis. Tex Heart Inst J. 2019;46:231-232. doi:10.14503/THIJ-17-6790
-
Wu J, Wu J, Zipes DP. Early Afterdepolarizations, U Waves, and Torsades de Pointes. Circulation. 2002;105:675-676. doi:10.1161/circ.105.6.675
-
Surawicz B. U Wave: Facts, Hypotheses, Misconceptions, and Misnomers. J Cardiovasc Electrophysiol. 1998;9:1117-1128. doi:10.1111/j.1540-8167.1998.tb00890.x
-
Ritsema Van Eck H, Kors J, Vanherpen G. The U wave in the electrocardiogram: A solution for a 100-year-old riddle. Cardiovascular Research. 2005;67:256-262. doi:10.1016/j.cardiores.2005.04.010
-
Pérez Riera AR, Ferreira C, Ferreira Filho C, Ferreira M, Meneghini A, Uchida AH et al. The enigmatic sixth wave of the electrocardiogram: The U wave. Cardiology Journal. 2008;15:14.