Abstract
Objectives:
In this study we evaluate the relationship between early stage of breast cancer diagnosis and geographic access to mammography in New York State
Methods:
We utilized indicators of spatial autocorrelation to assess if significant clusters of early stage breast cancer diagnosis and mammogram facilities occurred across NY counties over the years 2007-11. We used spatial autoregressive models to evaluate the importance of density and proximity of facilities in early stage cancer, controlling for several demographic and socioeconomic factors
Results:
Among 62 counties, the density of mammogram facilities varied from 0.2 to 2 sites/10,000 women, while distance to a facility from population centroid ranged between 0.44 to 38.58 miles. Four significant spatial clusters of high percentages of early stage breast cancer diagnosis were identified. The spatial autoregressive model indicated that the only statistically significant variable relating to higher percent of early stage at diagnosis was higher education (p=0.005).
Conclusion:
Using the county as the spatial unit of analysis, higher education was more significant than spatial access to mammography on the percent of early stage breast cancer diagnosis.
Introduction
Breast cancer is the second most prevalent cancer (25% of all cancers in 2012), and the most frequent type among women worldwide1 . In the U.S., the 2012 incidence rate was 119 cases/100,000 women. 1 2 In New York State (NY), the incidence rate was 124/100,000 women, slightly higher than the national rate. 3 Recent data suggest that 65% of breast cancer patients in NY are diagnosed at an early stage, with county averages ranging from 55% to 75%, indicating regional disparities. 4 The effects of screening mammography on breast cancer mortality has been controversial, yet many studies and expert opinion strongly advocate the positive effects of early detection on reducing mortality. 5 6 7
There are many factors that can potentially impact early diagnosis. First, minority women tend to present at later stages compared to Caucasian women, suggesting racial disparities, especially among Black and Hispanic. These disparities have been attributed to a number of factors, both clinical and non-clinical, and persist after controlling for other potential confounders such as socioeconomic status (SES), family history, insurance status, and screening mammography utilization. 8 9 10 One possible explanation centers on racial segregation, which can have negative effects on access to care and health outcomes. For example, a study in Detroit found that mammography access and black racial segregation were positively spatially correlated with later stage breast cancer diagnosis. 8 Similarly, neighborhood segregation based on income, educational attainment, and race in New York City was associated with the stage of breast cancer at time of diagnosis. 10
Second, SES is often associated with both breast cancer stage at diagnosis and general health outcomes. Higher educational attainment of a community was associated with a decreased risk of late stage presentation in New York City. 10 Moreover, in a review of 10 state cancer registries, including NY, lack of insurance, poverty, and Hispanic and black race/ethnicity were positively correlated with later stage at presentation. 11 12 A spatial analysis of late stage diagnosis in Florida using census block level data identified neighborhoods with high poverty levels to have as much as three times the risk of late stage diagnosis while controlling for other factors such as insurance status and mammography prevalence. 13 Low neighborhood SES was also found to be associated with late stage breast cancer diagnosis in Illinois. 14
Third, health insurance status needs to be considered in addressing stage of breast cancer diagnosis. Women with Medicaid or no insurance were almost three times as likely to have a stage III or IV rather than I or II diagnosis as compared to women with private insurance, especially among blacks and Hispanics. 15 16 17 Lack of health insurance was also found to be associated with the size of tumor at presentation. 18 In Michigan insurance status was found to be the most important predictor of access to mammogram screening. 19
In recent years, controversy has developed surrounding the risks and benefits of mammography. However, there is little dispute that mammography can detect smaller tumors, which would lead to earlier diagnosis, improved treatment outcomes, and better 5- year survival. 2 20 21 22 . U.S. preventative health policy dictates mammography as an optimal method of early detection. 23 Despite these recommendations, screening rates have declined in the U.S., and are particularly lower for women of racial minority and lower SES. 8 24 25
Few studies (with mixed results) have focused on proximity and density of mammography services and its effects on stage of diagnosis and mortality. Regarding density, some studies have found that greater mammogram density led to higher odds of screening or earlier stage of breast cancer diagnosis. 26 27 28 No significant association between distance to mammography facility and early stage breast cancer diagnosis has also been reported. 4 29 13 17 26 27 30 31 32 33 Despite these results, it was estimated that there needs to be approximately 1.2 mammogram facilities per 10,000 women over 40 years of age in order to comply with the Healthy People 2010 goal (70% screening). 34
This study aims to evaluate the relationship between stage of breast cancer diagnosis and access to mammography screening in NY. It utilizes geospatial techniques to appraise the potential impact of both the proximity to a mammography facility and the density of mammography facilities per county, controlling for demographic and socioeconomic factors. We choose to address both proximity and density in order to better inform future policy regarding the spatial distribution of new mammography units.
Materials and Methods
Conceptual Framework
From a socio-demographic perspective, NY has a very diverse population with extremes in racial segregation and social determinants of health, potential impacting stage of diagnosis. Additionally, NY encompasses rural and urban regions with varying densities of mammogram facilities (0-2.08 mammogram facilities/10,000 women) and a wide range of proximity to mammogram facilities (0.44-38.57 miles).
From a programmatic perspective, NY public health policy and practices are administered at county level health departments. Their focus is on prevention of communicable and noncommunicable diseases, including cancer services, health promotion, and a protection policy regarding environmental health hazards. 35 Additionally, NY provides free cancer screening for breast, cervical, and colorectal cancers for residents who are uninsured or underinsured and cannot afford the costs, through the county-level Cancer Services Program (CSP). 36 Over the years 2007-2011, 238,566 women used breast and/or cervical cancer screening services provided by CSP. As much as 98% of these women were uninsured, with the remaining being underinsured. Almost one third of the users self-identified as Hispanic. 37
The uniqueness of the CSP coupled with the socio-demographic and geographic diversity observed in NY may have important relationships with the stage of breast cancer diagnosis. We hypothesize that counties with higher density of mammogram facilities per 10,000 women and whose facilities are located at shorter distances will have higher rates of early breast cancer diagnosis. In addition, it is possible that some of the socio-demographic variables identified as important that correlate with the stage of breast cancer diagnosis in previous studies (e.g., minorities, uninsured) could have lower importance in NY due to the CSP.
Socio-demographic and cancer data
Data on the percentage of early diagnosis of breast cancer by county was obtained from the NY State Cancer Registry. 28 Data were available as an aggregated percentage from 2007- 2011. Information on health insurance status for females aged 18-65, language isolation, and poverty status were obtained from the NY State profile, National Cancer Institute SEER database for the year 2010. Language isolation, was defined as households in which no person aged 14 or more spoke only English, or spoke a language other than English at home, or was able to speak English fluently. 39 Poverty status was based on the percent of families living below the federal poverty line. 5
US Census data on age, race, gender, and educational attainment for the female population aged 18 and older by county in 2010 were extracted from the ESRI Business Analyst 2013 data package. After individually testing Pearson correlation between Black, Hispanic, and combined races with early stage at diagnosis, Black and Hispanic women were combined to generate the binary variable minority. Bachelor and graduate degrees were also collapsed to generate the binary variable higher education.
Spatial data
Boundary shape-files for NY counties were obtained from ESRI Data and Maps 2012, and projected into the NAD 1983 State Plane New York Central (US Feet) coordinate system. Socio-demographic data and information of breast cancer were merged with boundary shape-files using the county as the reference variable. All data were merged and processed in ArcMap v.10.2 (ESRI, Redlands, CA, USA).
Measures of density and proximity
Location of mammography facilities was obtained from the Food and Drug Administration (FDA) website, 40 and mapped utilizing boundary shape-files for NY counties. The total number of facilities per county was calculated, and density was defined as the number of facilities per 10,000 women older than 18, in order to take into account the fact that county size and population density varies across NY. Regarding proximity, we did not have exact locations of each woman diagnosed with breast cancer, but only an aggregated number for the county. Thus, for each county, the average distance between the population (females over age 18) centroid of the county and each mammography facility in the county was calculated. For counties that did not have any mammogram facility, the distance to the closest facility in neighboring counties was computed. All mapping and calculations were done in ArcMap v.10.2.
Spatial Analysis
The presence of spatial clusters in the percentage of early diagnosis of breast cancer, in the proximity to a mammography facility, and in the density of facilities was assessed though global and local Moran’s I indicators of spatial autocorrelation. 41 For both tests the weight matrix was defined based on a first-order queen neighborhood definition. Results of the local Moran’s I were corrected for multiple testing utilizing the False Discovery Rate (FDR) procedure. 42 Moran’s I calculations were done in ArcMap v.10.2, and the FDR correction was done in Microsoft Excel.
Correlates of early diagnosis of breast cancer
We constructed three Ordinary Least Squares (OLS) regression models to assess the correlates of early diagnosis of breast cancer. Model 1 focused on the density of mammography facilities, Model 2 focused on the distance to the facilities, and Model 3 combined both density and distance. Based on previous studies and on the conceptual framework presented above, all three models controlled for the following variables: (i) percentage of minority female population; (ii) higher education; (iii) percent uninsured; (iv) percent poverty; and (v) language isolation. We used Global Moran’s I indicator to test if the OLS residuals had any remaining spatial structure, in which case we considered the use of spatial autoregressive linear models. 6
The study only used data aggregated at the county level, and thus data with no identifiers. This qualified for an IRB exemption, as reviewed by the Harvard School of Public Health Ethical Review board.
Results
Spatial pattern of early diagnosis of breast cancer and mammography facilities
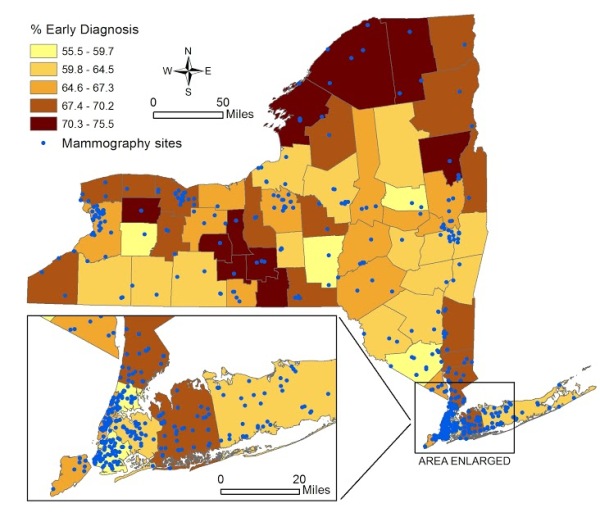
Figure 1 [fig. 1] shows the spatial distribution of the percentage of early diagnosis of breast cancer by county, and the location of mammogram facilities. The average percent of early diagnosis was 64.7% (minimum of 55.5% in Orange County, and maximum of 75.5% in Yates). The total number of mammogram facilities per county ranged from 0 (Tioga and Hamilton) to 68 (Kings). The average distance from population centroid to the nearest mammography facility ranged from 0.44 miles (Cayuga) to 38.6 miles (Hamilton).
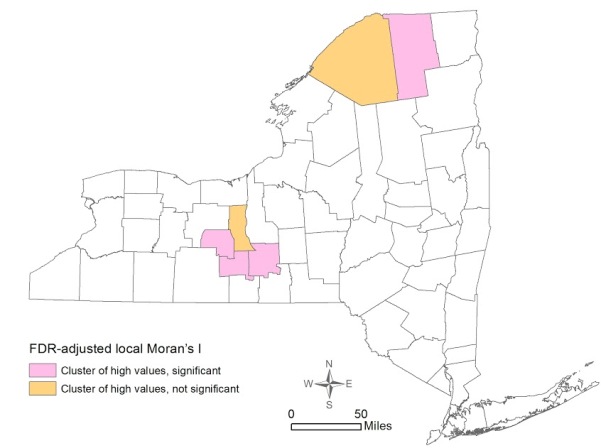
The global Moran’s I indicator for percent of early stage breast cancer diagnosis was 0.168 (p=0.0061), suggesting that the statewide distribution of early stage diagnosis is not random across counties. The FDR-adjusted local Moran’s I indicator showed the presence of four significant clusters of high percentage of early stage breast cancer diagnosis – Yates, Tompkins, Schuyler, and Franklin Counties (Figure 2) [fig. 2] .
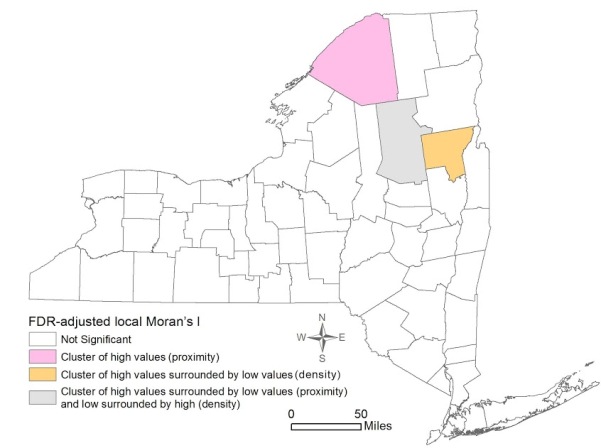
Figure 3 shows the local Moran’s I results for mammogram facility proximity and density. St. Lawrence was the only significant cluster of high proximity to mammogram facilities. Hamilton also revealed high proximity, but it was surrounded by areas with low proximity to a mammogram facility. However, despite the proximity, Hamilton was significant for a low density of mammogram facilities, surrounded by counties with high density. Lastly, Warren was significant for a pattern of high density surrounded by Counties with low density of facilities.
Correlates of early diagnosis of breast cancer
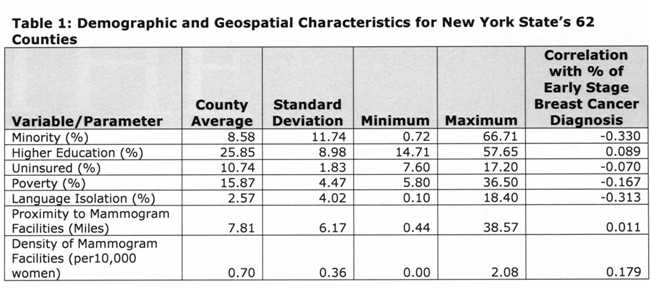
Table 1 [fig. 4] presents descriptive statistics of the variables included in the regression models, and the Pearson’s correlation index between each variable and the percentage of early stage diagnosis. Results indicate the vast county-level racial and socioeconomic diversity in NY State. For example, the county percent of black and Hispanic women varied from 0.72% (Essex) to 66.71% (Bronx). Minority status, poverty, uninsured, and language isolation had a negative correlation with percent of early diagnosis. In contrast, higher education and mammogram facility geographic variables were positively correlated with percent of early diagnosis.
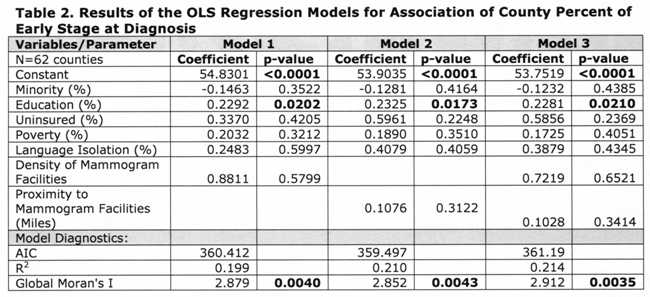
Table 2 [fig. 5] shows that proximity to and density of mammogram facilities did not have significant effects at the county level in any of the models. Education was the only variable significant in all models, with, approximately, a 10-percentage point increase in County percent of higher education associated with an increase of 2.3 percent of early stage diagnosis. Minority status displayed negative, although insignificant, associations with early stage at diagnosis for all three models.
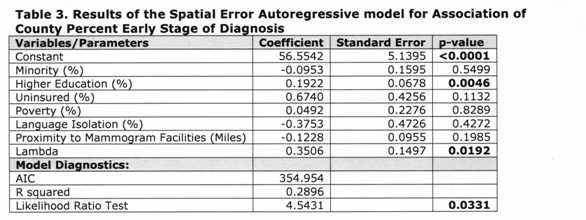
The residuals of the models indicated the presence of spatial autocorrelation, thus we ran a spatial error model (which assumes that the spatial structure left in the residuals is a result of unobservable factors), as indicated by the Lagrange Multiplier tests. 41 Since Model 2 (Table 2) had the lowest AIC, we only ran the error model considering the proximity variable. Table 3 [fig. 6] shows the results of the spatial autoregressive model. The coefficient of the spatial lag term on the residuals (lambda) was significant, indicating an improvement over the OLS models. This was also corroborated by a lower AIC and a higher R2 . Similarly to the OLS models, only education had a significant association with early stage breast cancer diagnosis; however the magnitude of the effect was slightly reduced.
Being black or Hispanic, living in language isolation, and living farther from a mammogram facility also lead to a later stage of diagnosis in the spatial model. Although the same was true for minority in the OLS model, living in language isolation and farther from a mammogram facility was associated with earlier stage of diagnosis. In contrast, counties that had more women with a bachelor or graduate degree, more uninsured women, and more families living below the poverty line had more consistent early stage at diagnosis. This was also consistent in the OLS model.
Discussion
This study found that the distribution of early stage breast cancer diagnosis by counties in NY State was not homogeneous, with four significant clusters of high percentage of early stage diagnosis observed in Yates, Tompkins, Schuyler, and Franklin Counties. Spatial patterns of density of and proximity to a mammogram facility were not similar: one county (St. Lawrence) was significant for a cluster of high proximity to mammogram facilities, and one county (Warren) was significant for a cluster of high density of facilities. Both OLS and spatial regression revealed that the only significant variable associated with early stage diagnosis was higher education. Neither density of nor proximity to a mammogram facility had significant effects considering the county as the unit of analysis.
The four counties with significant high rates of early diagnosis (Yates, Tompkins, Schuyler, and Franklin) have an ethnically homogenous population: low percentages of black women (1.0%-6.4%), Hispanic women (1.7%-4.6%), and language isolation (0.1%-5%). Higher education, however, was widely dispersed among these four counties ranging from 18% to 50%. Notably, Tompkins (home to Cornell University and Ithaca College) has the second highest educational attainment percentage among the 62 counties. In contrast to these four counties is the Bronx, which showed a low-low cluster for early stage at diagnosis, though not statistically significant. With an early diagnosis rate of 59.7%, 26% of families live under the poverty line, over 50% of the female population is either African American or Hispanic, only 18% of the population has a bachelor degree or higher, 18% of the population live in language isolation, and there are only 0.35 mammogram facilities per 10,000 women. Spatially, the Bronx is a predominantly lower SES area sandwiched between two primarily wealthy counties (Manhattan and Westchester).
Considering the estimation of 1.2 mammogram facilities per 10,000 women over 40 years of age in order to achieve 70% screening rate, 34 only five of the 62 counties in NY State met these standards (Warren, Delaware, Cortland, Franklin, and Otsego). With the exception of Cortland (64.3%), these counties registered a percent of early stage at diagnosis above the state average (1.4-9.3%). In addition, these counties had varied indicators of proximity to a mammogram facility: 2.54-23.3 miles. Although mammogram density and proximity were not found to be significant in the regression models, these variables do not take into account other important considerations such as financial access, waiting times, health literacy, perceived service quality, and health seeking behavior.
The only variable with a significant (and positive) association with early stage breast cancer diagnosis was higher education. This is consistent with prior research and suggests that higher education leads to more health awareness and literacy. Additionally, higher education may be related to increased awareness of the CSP in New York. It is often argued that breast cancer awareness and education, combined with a clinical exam, play a critical role as a driver of early detection and favorable outcomes, irrespective of mammography use. 8 43 In addition, it has been suggested that women with the greatest health awareness and literacy can identify breast cancer risks (such as lumps), and seek quick clinical care. 44 45
Greater levels of uninsured women and of poor families had a positive non-significant effect on percent of early diagnosis. While non-significant, this positive association could suggest a beneficial impact of NY’s free breast cancer screening program, which theoretically reduces financial barriers to screening mammography. In fact, from 2007-2011 roughly 170,000 women had screening mammography through the program and 93.7%-98.6% of these women were uninsured. In 2011-2012 alone, roughly 16% of women screened reported themselves as Black, and 31.1% as Hispanic. 37 Lastly, consistent with prior research, larger proportions of African American and Hispanic, as well as non-English speaking populations were associated with a lower percentage of early diagnosis (although the results were not significant). Perhaps a language barrier poses a challenge to accessing valuable information about health and health services, including knowledge about NY’s free screening program.
This study has several limitations. First, we did not have access to information on actual mammogram facility usage per county, which compared with the total number of women eligible for a mammogram could be an indication of coverage. Second, there are no data on individual knowledge, perception of risk, and behavior (perception of the need to have a mammography, perception of quality of services provided in mammogram facilities, etc.). Most importantly, we only had access to data at the county-level, and thus important intracounty heterogeneities and associations that present at a much more local-level could not be assessed. Ideally, an individual-level assessment, combining quantitative and qualitative methods, with good spatial coverage, would facilitate the assessment of intra- and intercounty differences, shedding light on the most recommended combinations of strategies that can promote awareness, increased screening, and ultimately result in higher rates of early stage breast cancer diagnosis.
Acknowledgements
We would like to acknowledge Jeffrey Blossom from the Center for Geographical Analysis at Harvard University, and Eleanor Murray from the Epidemiology Department at the Harvard School of Public Health for their technical assistance.
Figures
-
Figure 1. Percent of Early Stage Breast Cancer Diagnosis by County in New York State and Locations of Mammogram Facilities 2007-2011
-
Figure 2. Spatial Clustering of Early Stage Breast Cancer Diagnosis by County in New York State 2007-2011
-
Figure 3. Spatial clustering of Proximity to and Density of Mammogram Facilities in New York State by County 2007-2011
-
Table 1: Demographic and Geospatial Characteristics of New York State’s 62 Counties
-
Table 2: Results of the OLS Regression Models for Association of County Perfect of Early Stage at Diagnosis
-
Table 3: Results of the Spatial Error Autoregressive model for Association of County Perfect Early Stage Diagnosis
References
-
International Agency for Research on Cancer. GLOBOCAN. Cancer Fact Sheet: Breast. 2012. Available at: http://globocan.iarc.fr/Pages/fact_sheets_population.aspx Accessed April 21 2014.
-
U.S. Cancer Statistics Working Group. United States Cancer Statistics: 1999–2010 Incidence and Mortality Web-based Report. Atlanta: U.S. Department of Health and Human Services, Centers for Disease Control and Prevention and National Cancer Institute; 2013. Available at: http://www.cdc.gov/uscs. Accessed April 30 2014.
-
New York Cancer Registry. Cancer Incidence and Mortality in New York State. 1976-2011. Available at: http://www.health.ny.gov/statistics/cancer/registry/table1/tb1nys.htm Accessed April 30 2014.
-
New York Cancer Registry. Percent of Cancers Diagnosed at an Early Stage by County,. 2007-2011. Available at https://www.health.ny.gov/statistics/cancer/registry/table3/tb3county.htm. Accessed April 20 2014.
-
Hoerger TJ, Ekwueme DU, Miller JW, et al. Estimated effects of the National Breast and Cervical Cancer Early Detection Program on breast cancer mortality. Am J Prev Med 2011; 40: 397-404
-
Sener SF, Cady B, Merkel D. Primary factor in declining breast cancer mortality rates: early detection or adjuvant therapy? Cancer Pract 2002; 10: 45-7.
-
Vilaprinyo E, Puig T, Rue M. Contribution of early detection and adjuvant treatments to breast cancer mortality reduction in Catalonia, Spain. PLoS One 2012; 7: e30157.
-
Dai D. Black residential segregation, disparities in spatial access to health care facilities, and late-stage breast cancer diagnosis in metropolitan Detroit. Health Place 2010; 16: 1038-52.
-
Jones BA, Kasl SV, Curnen MG, Owens PH, Dubrow R. Can mammography screening explain the race difference in stage at diagnosis of breast cancer? Cancer 1995; 75: 2103-13
-
Merkin SS, Stevenson L, Powe N. Geographic socioeconomic status, race, and advanced-stage breast cancer in New York City. Am J Public Health 2002; 92: 64-70.
-
K. A. Henry FPB, C. J. Johnson, D. W. Goldberg, R. Sherman, M. Cockburn. Breast cancer stage at diagnosis: is travel time important? . J Community Health 2011; 36: 933-42.
-
K. A. Henry RS, S. Farber, M. Cockburn, D. W. Goldberg and A. M. Stroup. The joint effects of census tract poverty and geographic access on late-stage breast cancer diagnosis in 10 US States. Health Place 2013; 21: 110-21.
-
MacKinnon JA, Duncan RC, Huang Y, et al. Detecting an association between socioeconomic status and late stage breast cancer using spatial analysis and area-based measures. Cancer Epidemiol Biomarkers Prev 2007; 16: 756-62.
-
Wang F, Luo L, McLafferty S. Healthcare access, socioeconomic factors and late-stage cancer diagnosis: an exploratory spatial analysis and public policy implication. Int J Public Pol 2010; 5: 237-58.
-
Halpern MT, Ward EM, Pavluck AL, Schrag NM, Bian J, Chen AY. Association of insurance status and ethnicity with cancer stage at diagnosis for 12 cancer sites: a retrospective analysis. Lancet Oncol 2008; 9: 222-31.
-
Halpern MT, Bian J, Ward EM, Schrag NM, Chen AY. Insurance status and stage of cancer at diagnosis among women with breast cancer. Cancer 2007; 110: 403-11.
-
Henry KA, Sherman R, Farber S, Cockburn M, Goldberg DW, Stroup AM. The joint effects of census tract poverty and geographic access on late-stage breast cancer diagnosis in 10 US States. Health Place 2013; 21: 110-21.
-
Kuzmiak CM, Haberle S, Padungchaichote W, Zeng D, Cole E, Pisano ED. Insurance status and the severity of breast cancer at the time of diagnosis. Acad Radiol 2008; 15: 1255-8.
-
Akinyemiju TF, Soliman AS, Yassine M, Banerjee M, Schwartz K, Merajver S. Healthcare access and mammography screening in Michigan: a multilevel cross-sectional study. Int J Equity Health 2012; 11: 16.
-
Miller AB, Wall C, Baines CJ, Sun P, To T, Narod SA. Twenty five year follow-up for breast cancer incidence and mortality of the Canadian National Breast Screening Study: randomised screening trial. Bmj 2014; 348: g366.
-
Onitilo AA, Engel JM, Liang H, et al. Mammography utilization: patient characteristics and breast cancer stage at diagnosis. AJR Am J Roentgenol 2013; 201: 1057-63.
-
McElroy JA, Remington PL, Gangnon RE, Hariharan L, Andersen LD.Identifying geographic disparities in the early detection of breast cancer using a geographic information system. Prev Chronic Dis 2006; 3: A10.
-
U.S. Preventive Services Task Force. Screening for Breast Cancer, Topic Page. July 2010. Available at: http://www.uspreventiveservicestaskforce.org/uspstf/uspsbrca.htm. Accessed May 1 2014.
-
Wells KJ, Roetzheim RG. Health disparities in receipt of screening mammography in Latinas: a critical review of recent literature. Cancer Control 2007; 14: 369-79.
-
Miranda PY, Tarraf W, Gonzalez HM. Breast cancer screening and ethnicity in the United States: implications for health disparities research. Breast Cancer Res Treat 2011; 128: 535-42
-
Elting LS, Cooksley CD, Bekele BN, et al. Mammography capacity impact on screening rates and breast cancer stage at diagnosis. Am J Prev Med 2009; 37: 102-8.
-
Marchick J, Henson DE. Correlations between access to mammography and breast cancer stage at diagnosis. Cancer 2005; 103: 1571-80.
-
Meersman SC, Breen N, Pickle LW, Meissner HI, Simon P. Access to mammography screening in a large urban population: a multi-level analysis. Cancer Causes Control 2009; 20(8): 1469-82.
-
Rahman S, Price JH, Dignan M, Rahman S, Lindquist PS, Jordan TR. Access to Mammography Facilities and Detection of Breast Cancer by Screening Mammography: A GIS Approach. Int J Canc Prev 2009; 2(6): 403-13
-
Gumpertz ML, Pickle LW, Miller BA, Bell BS. Geographic patterns of advanced breast cancer in Los Angeles: associations with biological and sociodemographic factors (United States). Cancer Causes Control 2006; 17: 325-39.
-
Celaya MO, Berke EM, Onega TL, et al. Breast cancer stage at diagnosis and geographic access to mammography screening (New Hampshire, 1998-2004). Rural Remote Health 2010; 10: 1361.
-
Henry KA, Boscoe FP, Johnson CJ, Goldberg DW, Sherman R, Cockburn M. Breast cancer stage at diagnosis: is travel time important? J Community Health 2011; 36: 933-42.
-
Huang B, Dignan M, Han D, Johnson O. Does distance matter? Distance to mammography facilities and stage at diagnosis of breast cancer in Kentucky. J Rural Health 2009; 25: 366-71.
-
Elkin EB, Ishill NM, Snow JG, et al. Geographic access and the use of screening mammography. Med Care 2010; 48: 349-56.
-
New York State Association of county Health Officials. Programs. Available at: http://www.nysacho.org/i4a/pages/index.cfm?pageid=3292 Accessed May 2 2014
-
New York State Department of Health. Cancer Services Program. Available at: http://www.health.ny.gov/diseases/cancer/services/community_resources/ Accessed May 2 2014.
-
New York State Department of Health. Breast and Cervical Cancer Early Detection Program Report. New York, 2012. Available at: http://www.health.ny.gov/diseases/cancer/cervical/resources/docs/2011-2012_cervical_cancer_prevention_report.pdf. Accessed August 10, 2014.
-
New York State Cancer Registry. Available at: http://www.health.ny.gov/statistics/cancer/registry/ Accessed April 30 2014.
-
Surveillance, Epidemiology, and End Results Program. Descriptions of County Attributes. Available at: http://seer.cancer.gov/seerstat/variables/countyattribs/ Accessed June 9 2014
-
Food and Drug Administration. Mammography Facilities in New York State. Available at: http://www.accessdata.fda.gov/scripts/cdrh/cfdocs/cfMQSA/mqsa.cfm Accessed April 30 2014.
-
Anselin, L. Local indicators of spatial association — LISA. Geographical Analysis, 1995;27: 93-115. doi: 10.1111/j.1538-4632.1995.tb00338.x
-
Castro, M. C., & Singer, B. H. Controlling the false discovery rate: A new application to account for multiple and dependent tests in local statistics of spatial association. Geographical Analysis, 2006;38: 180-208. doi: 10.1111/j.0016-7363.2006.00682.x.
-
Anderson BO. Breast cancer–thinking globally. Science 2014; 343: 1403.
-
Kiviniemi MT, Hay JL. Awareness of the 2009 US Preventive Services Task Force recommended changes in mammography screening guidelines, accuracy of awareness, sources of knowledge about recommendations, and attitudes about updated screening guidelines in women ages 40-49 and 50+. BMC public health 2012; 12: 899.
-
Bello M. Awareness is the first step in battle against breast cancer. Bulletin of the World Health Organization 2012; 90: 164-5.